dxy analysis 06/10/2024
This is the monthly chart of the DXY. The first week of October started with a bang with escalation of geopolitical tensions between Iran and Israel has caused money to flow into the US dollar. If you notice closely, the price took out a previous swing low 10 months back. Price has now taken out the previous month’s high and it looks as though a new swing low has formed. From a monthly perspective we cannot assume anything as the current candle is still in the process of forming and we have to wait till the current candle closes, before we can say for sure that a swing low has formed. Price has is currently above the 50 month EMA.
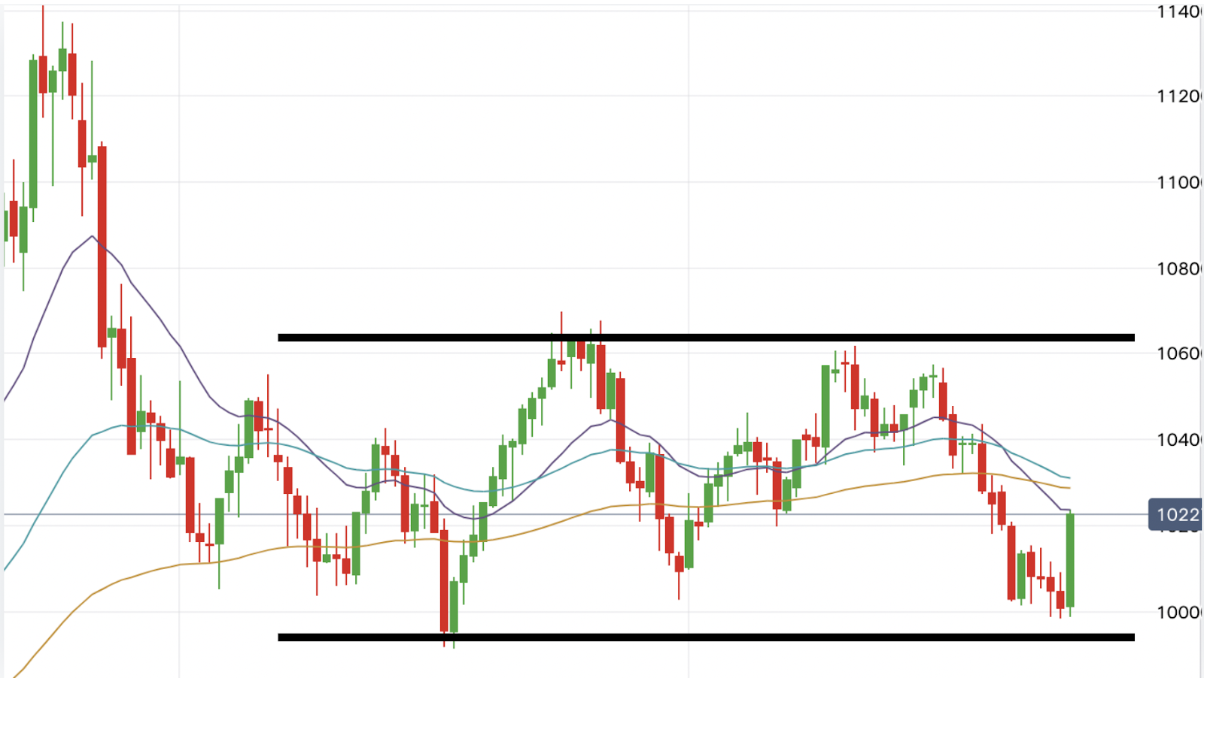
On the weekly chart, we are in a range since January 2023. The price was at the bottom of the range. All it needed was a catalyst to send the price higher. The price has broken structure on a weekly basis and now the market structure is bullish. We can see this better on the line chart.
so any move down on the dxy will be supported either at the neckline or an imbalance below that line. We can see this better on the daily chart.
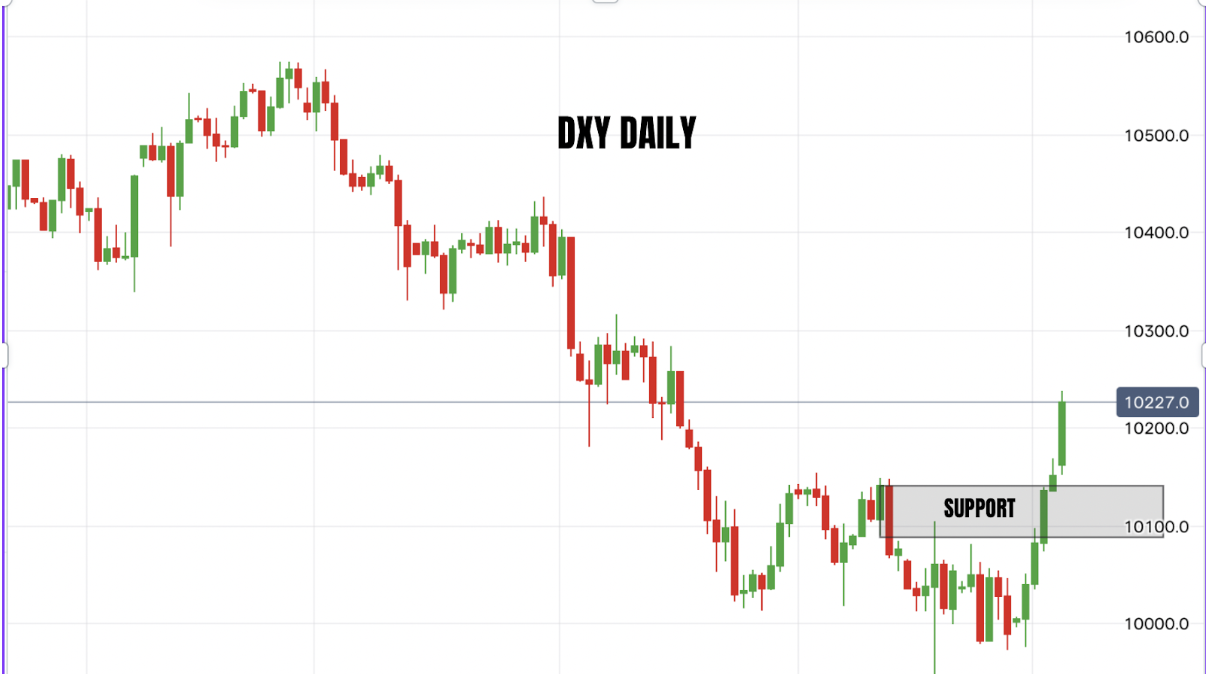
This is the daily chart of the DXY. here we see the strong move up breaking market structure. The shaded area is the support and if price comes to this level next week, then longs can be framed on lower timeframes targeting previous week’s high. If price goes below the zone, then it is very likely the bullish bias has been negated. So although we go into next week with a bullish bias, we should not be married to the bias. We look for setups and if those setups fail, then we move to the next opportunity.
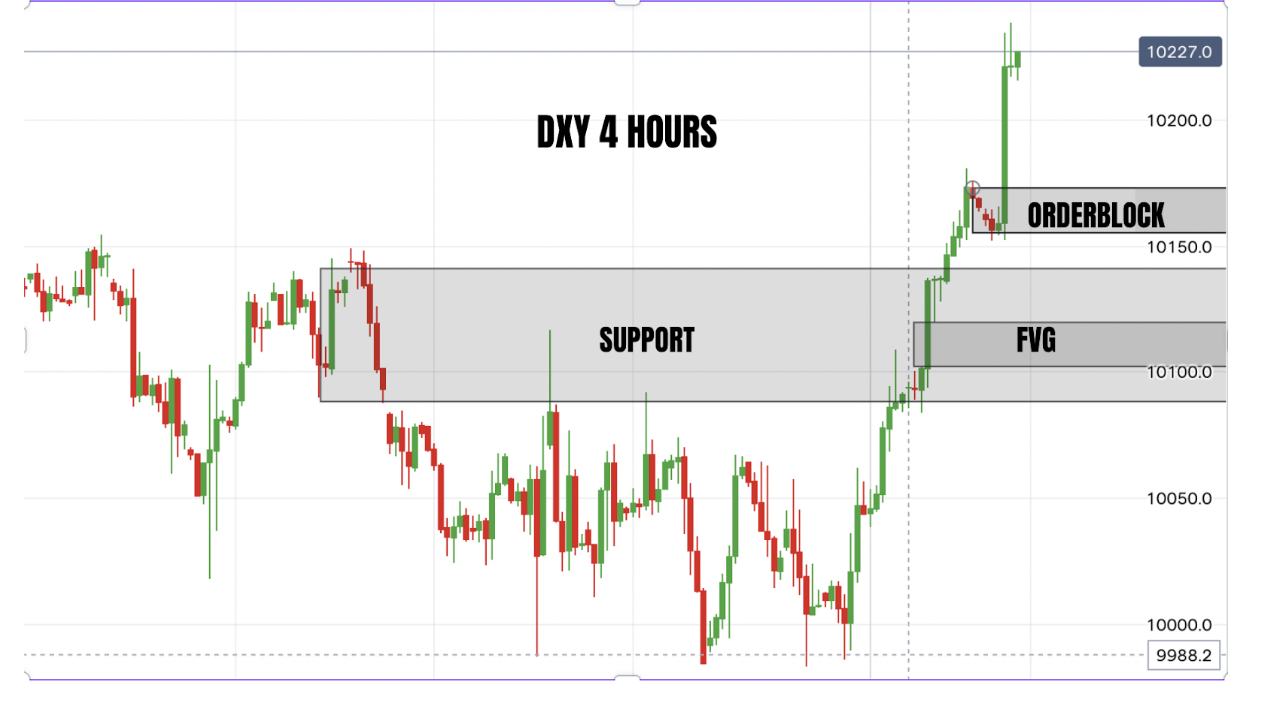
This is the 4 hour chart. We look for further areas of support and resistance. We have the orderblock at the top and the FVG in the support zone. We will have to assess the price action on monday and tuesday before we can be sure as to what liquidity that the algorithm will seek.
We have the CPI on Thursday and PPI on friday. So more than likely we may have range bound conditions until then. So it is best to wait till wednesday and see how the price has been delivered. We then look at the market structure and liquidity pools and make a decision on which side we will take the trades on.
so in summary, we go into the week with a bullish bias, we look at price action in the support zone and look for bullish setups. If the support fails, then we either stay on the sidelines or we take the opposite direction.


